Shifting Ground: How to Detect Market Regime Changes Before the Rest of the Room Does
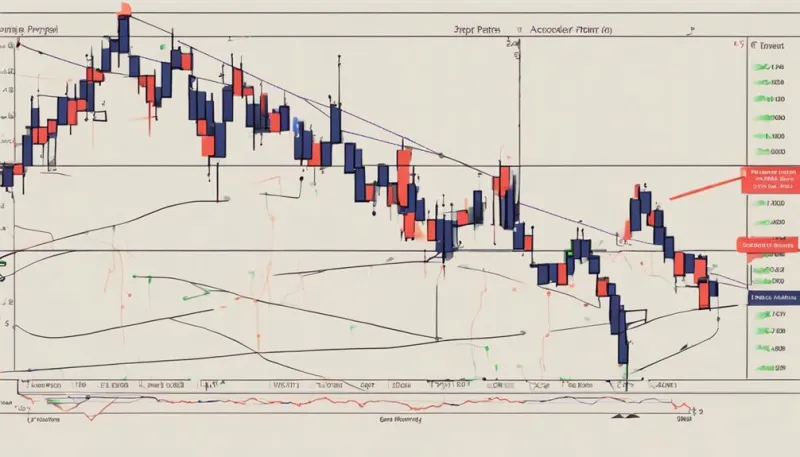
Photo: market regime analysis technical indicators trading screen charts, via www.senatormensch.com
Every experienced trader eventually confronts the same frustrating scenario: a strategy that has been performing consistently suddenly stops working. Trend-following entries produce whipsaws. Breakout trades reverse immediately. Volatility that seemed contained explodes without apparent warning. In most cases, the culprit is not a flawed strategy—it is a market that has changed its character while the trader continued applying rules designed for a different environment.
Market regimes—the underlying behavioral states that define how price moves—shift constantly. Trending markets give way to consolidation. Low-volatility ranges compress until they detonate into directional moves. High-volatility environments exhaust themselves and flatten into chop. The ability to detect these transitions early, before they are obvious to the broader market, is one of the most durable edges available to active traders.
Understanding the Three Primary Regimes
Before examining how to identify regime shifts, it is worth establishing a clear framework for what constitutes a regime in the first place.
Trending regimes are characterized by sustained directional movement, higher highs and higher lows (or the inverse), and price that consistently respects momentum. Trend-following strategies perform well here. Mean-reversion approaches are punished.
Ranging regimes are defined by oscillation between established support and resistance levels, with no sustained directional bias. Mean-reversion and range-trading strategies thrive. Breakout systems generate false signals repeatedly.
Volatility expansion regimes involve rapid, often disorderly price movement, frequently accompanied by elevated volume and widening spreads. These periods can occur within trends or ranges and demand different risk parameters from both.
The critical insight is that most retail trading systems are calibrated for one regime. Applying a trending strategy to a ranging market, or a range strategy to a breakout environment, is not a matter of bad luck—it is a structural mismatch.
Early Warning Signal One: Average True Range Divergence
One of the most reliable early indicators of a regime shift is a divergence between price behavior and the Average True Range (ATR). When price is consolidating but ATR begins expanding, this suggests that volatility is building beneath the surface—pressure accumulating before a directional release.
Conversely, when a strong trend is in place but ATR begins contracting over successive sessions, this frequently signals exhaustion. The trend may not reverse immediately, but the environment is transitioning. Momentum is decelerating even if price has not yet confirmed it.
US traders monitoring major forex pairs—EUR/USD, GBP/USD, or USD/JPY—should track ATR on both the daily and four-hour timeframes simultaneously. A contraction on the daily while the four-hour begins to expand is a particularly notable signal, suggesting that a short-term volatility catalyst is approaching within a broader context of reduced momentum.
Early Warning Signal Two: Volume Behavior at Key Levels
Volume patterns are among the most informative—and most underutilized—tools in technical analysis. In forex markets, where centralized volume data is unavailable, tick volume serves as a reasonable proxy for participation levels.
When price approaches a significant support or resistance level with diminishing tick volume, it suggests that conviction is waning. A breakout attempted on low volume has a substantially higher probability of failure than one accompanied by a surge in participation. This is not merely a directional signal—it is a regime signal. Low-volume breakouts frequently indicate that the market is about to revert to range behavior rather than establish a new trend.
Conversely, when volume expands sharply during a period of range compression—particularly if this coincides with a news catalyst or a session open—it often marks the beginning of a trending regime. The participation surge indicates that institutional actors are committing to a directional move, which tends to attract further momentum.
Early Warning Signal Three: Moving Average Slope and Spacing
The geometry of moving averages provides a straightforward visual representation of regime character. When a short-term moving average (such as the 20-period) and a medium-term average (50-period) are well-separated and sloping decisively in the same direction, the market is in a trending regime. When these averages begin converging and flattening, a transition toward ranging behavior is underway.
The slope change typically precedes the price confirmation by several sessions. A trader monitoring the angle of the 20-period EMA on a daily chart will often observe it beginning to flatten before price has visibly stalled. This early signal provides a window for adjusting position sizing, tightening stops, or switching from momentum-based entries to range-bound tactics.
Early Warning Signal Four: Price Action Structure Deterioration
Perhaps the most nuanced—but most powerful—signal of a regime shift is a change in the quality of price action structure. In a healthy trend, pullbacks are orderly: price retraces to a logical level, consolidates briefly, and resumes the primary direction. When this structure begins to deteriorate—when pullbacks become deeper, when the consolidation periods extend, when former support levels are tested multiple times rather than respected on the first approach—the trend is signaling internal weakness.
These structural changes are visible on candlestick charts to any trader who is looking for them. The challenge is that most traders are focused on confirming their existing directional bias rather than evaluating the quality of the structure itself. Developing the discipline to assess structure objectively, independent of your current position, is a skill that separates consistent performers from reactive ones.
Applying Regime Awareness to Real Trading Decisions
The practical application of regime detection is straightforward once the signals are internalized. Before entering any new position, assess which regime the target instrument is currently operating in. Then ask whether your intended strategy is designed for that regime. If the answer is no—or if the signals suggest a transition is imminent—either wait for clarity or select a strategy appropriate to the emerging environment.
At IC Markets ZHV, the analytical framework available to traders supports exactly this kind of systematic pre-trade assessment. Reviewing ATR behavior, volume patterns, moving average geometry, and price action structure before execution transforms regime awareness from a theoretical concept into a repeatable process.
The Competitive Advantage of Early Recognition
Markets reward anticipation. The traders who identify a regime shift while the majority are still operating under outdated assumptions gain access to position entries with superior risk-reward profiles. They are adjusting their strategies while others are absorbing losses and wondering why their edge has disappeared.
This is not about predicting the future with certainty. It is about reading the available evidence—ATR, volume, moving average geometry, price structure—and updating your behavioral assumptions before the market forces you to. In forex and CFD trading, that distinction is worth a great deal.