Ghost Moves: Detecting Institutional Exits Before the Price Chart Tells the Story
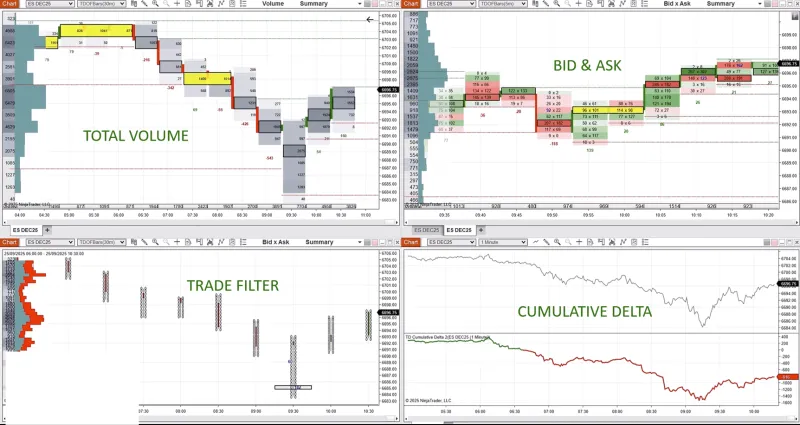
Photo: institutional trading order flow volume analysis financial market data screen, via www.trader-dale.com
There is a persistent frustration among active traders: by the time a reversal looks obvious, the opportunity has already closed. Price has moved, momentum has shifted, and the traders who acted early are already managing their gains while latecomers absorb slippage. The reason this pattern repeats itself is not random. It reflects a structural information asymmetry between institutional participants and the broader market—one that shows up in the data before it ever shows up in price.
Institutional players—prime brokers, hedge funds, large asset managers—cannot exit positions the way a retail trader can. They cannot simply hit a sell button and be done with it. Their size demands discretion, and that discretion leaves traces. Learning to read those traces is one of the most valuable skills an active trader can develop.
Why Institutions Cannot Hide Completely
The mechanics of institutional order management create an inherent tension. A fund managing a $400 million forex position cannot liquidate in a single transaction without moving the market against itself. Instead, it must distribute its selling across time, venues, and order types—breaking a large exit into hundreds or thousands of smaller transactions that blend into normal market activity.
But this distribution process, however carefully managed, generates patterns that differ measurably from ordinary flow. Volume behaves differently. Spreads respond in unusual ways. The relationship between price movement and transactional activity begins to diverge. For a trader equipped with the right analytical framework, these divergences are readable signals rather than background noise.
Volume Divergence: When Activity and Price Tell Different Stories
The most accessible early warning signal involves the relationship between volume and price momentum. In a healthy trend, volume and price tend to confirm each other—rising prices accompanied by rising volume, falling prices accompanied by elevated selling volume. When that relationship breaks down, it often indicates that the apparent trend is being sustained by fewer and fewer participants.
In practice, this looks like continued upward price movement accompanied by declining or erratic volume. The price is still advancing, but the transactional activity supporting it is thinning. What is frequently happening beneath the surface is that institutional sellers are distributing inventory into the residual buying demand from retail and algorithmic participants who are still chasing the trend. Price holds up—or even nudges higher—precisely because the selling is being carefully rationed to avoid triggering a visible breakdown.
US equity index traders will recognize this pattern from numerous top formations in major indices. It appears with equal regularity in forex pairs, particularly in trending majors like EUR/USD and GBP/USD when a directional move has been running for several weeks. When volume begins declining on rally days and increasing on pullback days, the weight of evidence is shifting toward distribution rather than accumulation.
Bid-Ask Spread Behavior as a Diagnostic Tool
Spread dynamics offer a second, often underutilized window into institutional activity. In liquid forex markets, spreads under normal conditions are tight and stable. When spreads begin widening without an obvious news catalyst—and particularly when they widen asymmetrically on one side of the book—it frequently reflects a withdrawal of liquidity provision by market makers who are themselves repositioning or responding to large directional flow.
Pay particular attention to spread behavior at technically significant levels: prior highs, round numbers, and key moving averages. If price approaches a major resistance level and spreads begin widening before any visible rejection, it suggests that liquidity providers are pulling bids in anticipation of selling pressure. The spread itself is acting as a leading indicator.
This dynamic is especially relevant for traders operating during the New York session, when the overlap with European liquidity can create sharp, short-lived spread anomalies that precede significant intraday moves. Tracking spread behavior in real time—rather than relying solely on price action—adds a dimension of analysis that most retail-oriented platforms obscure.
Quote Stuffing and Order Flow Distortion
At a more granular level, sophisticated traders monitor for quote stuffing patterns—rapid sequences of order placements and cancellations that temporarily distort the visible order book without resulting in actual transactions. While this behavior is associated with high-frequency trading strategies, its appearance in the book around key price levels often signals that larger participants are probing liquidity conditions or masking their true intentions.
For most active traders, direct observation of quote stuffing requires level II data or access to depth-of-market feeds. But its secondary effects are observable through more accessible means. When the spread oscillates rapidly without price moving, or when the order book shows sudden depth at a particular level that disappears before price reaches it, these are surface expressions of the same underlying dynamic.
The practical implication is straightforward: treat sudden, unexplained changes in book depth near key technical levels as a potential signal of institutional positioning activity rather than as random noise.
The Footprint of Institutional Exits in Forex
In the forex market specifically, institutional exits often leave a characteristic footprint in the time-and-sales data. Large participants frequently use iceberg orders—orders with a visible portion and a much larger hidden component—to manage their exit without revealing full size. The tell is a pattern of consistent selling at a specific price level despite apparent buying pressure, with transactions repeatedly printing at or just below a round number or prior high.
When you observe price repeatedly testing a resistance level and failing to close above it, while the transaction tape shows sustained volume printing at that level, the probability is elevated that a large seller is working an iceberg order against the incoming buy flow. This is not a reversal signal on its own, but combined with the volume divergence and spread behavior described above, it contributes to a coherent picture of institutional distribution.
Constructing an Exit-Detection Framework
The signals described in this article are most powerful when used in combination rather than in isolation. A practical framework for US active traders might look as follows:
Step one involves monitoring rolling volume relative to a 20-period average. When volume on up-bars drops below 70% of the average while price continues to advance, flag the pair for closer observation.
Step two involves tracking spread behavior at key levels. A spread that widens by 20% or more at a technically significant price without a news catalyst warrants attention.
Step three involves reviewing the transaction tape for iceberg-type patterns: repeated fills at the same price level despite directional price pressure in the opposite direction.
When all three conditions align, the probability of an imminent institutional exit—and therefore a price reversal—is materially higher than at any single signal in isolation. This is the moment to reduce long exposure, tighten stops, or begin building a counter-directional position with defined risk parameters.
Staying Ahead of the Visible Move
The traders who consistently identify reversals early are not operating on intuition. They are reading a set of behavioral signals that institutions, despite their sophistication, cannot fully eliminate. Volume divergence, spread anomalies, and order flow distortions are not perfect predictors, but they are systematic, observable, and repeatable.
At IC Markets ZHV, the emphasis on deeper market analysis reflects a recognition that price alone is an incomplete picture. The traders who trade smarter are those who look beyond the candlestick and into the underlying mechanics of how large money enters—and more importantly, exits—the market. That is where the real edge lives.