When Your Safety Net Becomes a Snare: The Hidden Failure of Hedges During Market Shocks
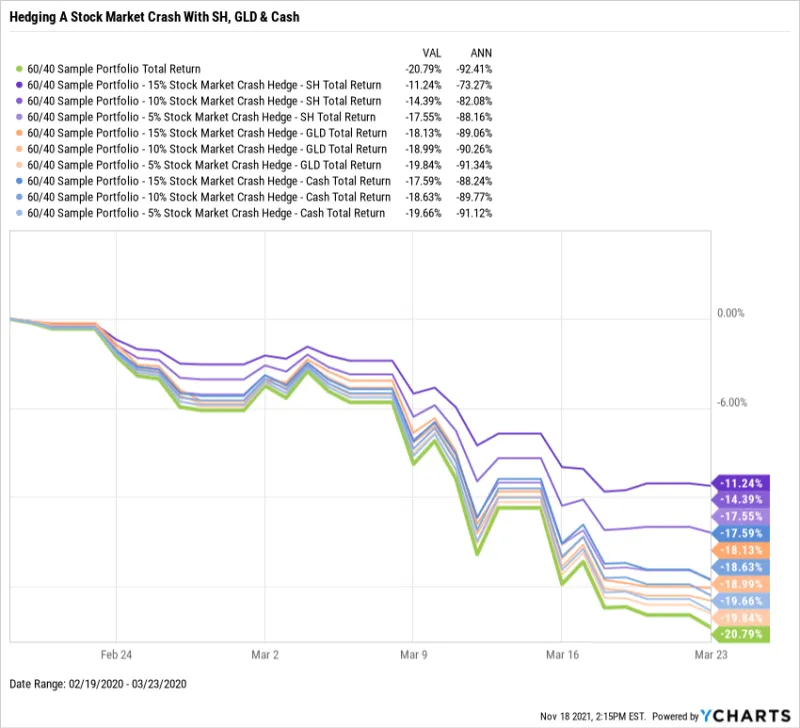
Photo: financial market crash safety net hedge trading risk, via get.ycharts.com
There is a particular kind of financial pain that comes not from taking no precautions, but from believing your precautions were sufficient. For a significant number of active traders in the United States, the hedge they constructed during calmer conditions turned out to be exactly that — a belief, not a barrier. When volatility spikes sharply and unexpectedly, the statistical relationships underpinning most hedge strategies have a documented tendency to break down precisely when they are needed most.
Understanding why this happens — and what to do about it — is not merely academic. It is a practical requirement for anyone trading forex pairs, equity index CFDs, or commodity-linked instruments at IC Markets ZHV.
The Correlation Assumption and Where It Breaks
At the core of most hedging strategies is a correlation coefficient: a number between -1 and +1 that describes how two assets tend to move relative to one another. A correlation of -1 suggests perfect inverse movement; if one asset falls, the other rises. Traders frequently construct hedges around pairs that have historically demonstrated strong negative correlation — gold and the US dollar, for instance, or certain equity sectors against Treasury bonds.
The problem is that historical correlation is measured across normal market conditions. During a flash crash — the kind that wiped hundreds of points off equity indices in minutes during events like the August 2015 Chinese devaluation shock or the March 2020 pandemic sell-off — liquidity evaporates across virtually all asset classes simultaneously. When institutional participants pull back and algorithmic systems trigger cascading sell orders, the usual behavioral distinctions between assets temporarily cease to matter.
What traders observe during these episodes is correlation convergence: assets that ordinarily move in opposite directions begin moving together, all of them downward. The statistical comfort of a -0.72 correlation becomes meaningless when panic-driven liquidation overrides every normal price relationship in the market.
The Statistical Illusion of Diversification
Diversification and hedging are related concepts but they are not identical, and conflating them is a costly error. A diversified portfolio spreads exposure across uncorrelated assets; a hedge is a deliberate offsetting position designed to limit loss on a specific trade or book. Both strategies, however, share the same vulnerability: they assume that the structural relationships between assets will remain stable under stress.
Research in behavioral finance has repeatedly demonstrated that during extreme volatility events, cross-asset correlations shift dramatically toward 1.0 — meaning everything falls together. This phenomenon, sometimes referred to as correlation breakdown or tail-risk correlation, is not a rare anomaly. It is a consistent feature of how markets behave during crises.
Consider a trader holding a long position in EUR/USD who has hedged using a short position in a US equity index CFD, based on an observed negative correlation during the previous six months. Under normal conditions, a dollar-strengthening event might push EUR/USD lower while also pressuring equities, providing a partial offset. During a flash crash, however, a sudden risk-off event can simultaneously crush both positions as capital flees all risk-sensitive assets indiscriminately.
The hedge did not fail because it was poorly constructed. It failed because the correlation it was built upon was a product of the environment, not an immutable law.
Stress-Testing Your Hedge Before the Market Does It for You
The most effective way to identify whether a hedge will hold under duress is to simulate its behavior under historical stress scenarios before committing real capital. This process, broadly called stress-testing, involves applying the price action from past high-volatility events to your current position structure and observing where the model breaks.
A practical framework for US traders includes the following steps:
Step 1: Identify your correlation assumption. Write down explicitly what relationship you are relying upon. If you cannot state it clearly, you do not fully understand your hedge.
Step 2: Source the correlation data across different time windows. A correlation that holds over twelve months may look very different over thirty days of elevated volatility. Examine both.
Step 3: Apply historical shock scenarios. Use data from events such as the 2010 Flash Crash, the 2015 August selloff, the 2018 volatility spike, and March 2020. Overlay your hedge structure onto those conditions and calculate what your net exposure would have been.
Step 4: Identify the break point. At what level of volatility or correlation shift does your hedge stop providing protection and begin amplifying your losses?
Step 5: Build a contingency trigger. Establish in advance the conditions under which you will exit or restructure the hedge. Waiting until the crash is underway is almost always too late.
Identifying True Risk Offsets Versus False Comfort
Not all hedges are created equal. The distinction between a genuine risk offset and a false comfort position often comes down to the nature of the instrument used and the liquidity conditions under which it will need to perform.
Options-based hedges, for example, provide defined protection because their payoff structure is contractual rather than correlation-dependent. A put option on an index does not require the underlying market to behave in a particular way relative to another asset — it simply pays out if the index falls below the strike price. This is a structurally different kind of protection than a correlation-dependent offsetting position.
For traders using CFDs and forex positions at IC Markets ZHV, the practical implication is that hedging through correlated asset pairs should be treated as a soft buffer rather than a hard guarantee. It may reduce volatility in your portfolio under normal conditions, but it should not be your primary line of defense against tail risk.
The more disciplined approach involves layering protections: using position sizing to limit maximum loss on any single trade, maintaining adequate margin buffers so that a short-term correlation breakdown does not trigger a forced liquidation, and treating correlation-based hedges as supplementary rather than definitive.
The Takeaway for Active Traders
The appeal of a hedge is psychological as much as financial. It allows traders to feel that risk has been managed, which can paradoxically encourage larger position sizes and reduced vigilance. This is perhaps the most dangerous consequence of a poorly constructed hedge — not that it fails to protect, but that its presence creates a false sense of security that leads to greater overall exposure.
Markets during flash crashes do not reward the assumption that the past will predict the future. The traders who navigate these events most effectively are those who stress-tested their strategies in advance, understood exactly where their protection ended, and had predetermined responses ready before the alarm was triggered.
At IC Markets ZHV, the tools to conduct this kind of analysis are available to every active trader. The discipline to use them consistently is what separates those who survive volatility spikes from those who are undone by them.