The Invisible Scoreboard: How Institutional Traders Read Order Flow to Stay One Step Ahead

Photo: Internet Archive Book Images, No restrictions, via Wikimedia Commons
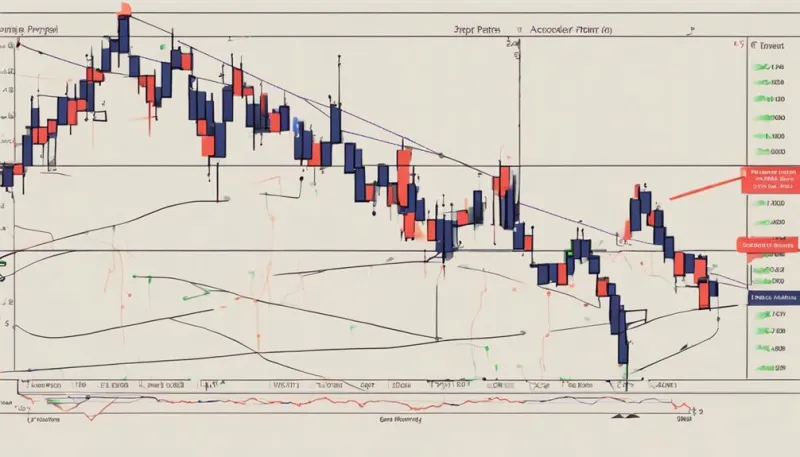
Most retail traders in the United States spend the majority of their analytical time studying charts. They examine candlestick patterns, draw support and resistance lines, apply moving averages, and construct elaborate setups based on what price has done in the past. What they rarely examine with equal rigor is the data that sits beneath the price — the record of every order placed, modified, and executed in real time. That data, known broadly as order flow, is the primary lens through which professional and institutional traders view the market. And the gap between how institutions read that information and how retail participants read it is one of the most consequential asymmetries in active trading.
What Order Flow Actually Represents
Price on a chart is a historical record. It tells you what happened. Order flow, by contrast, is a live document — it shows you the intentions, commitments, and anxieties of every participant currently active in the market.
At its most fundamental level, order flow analysis involves examining two things: where volume is occurring and at what price levels orders are resting or being absorbed. When large institutional participants — hedge funds, proprietary trading desks, major banks — enter or exit positions, they leave footprints in the order book that attentive traders can learn to read.
This is not a theoretical exercise. The mechanics of how orders interact with liquidity are deterministic. When a large market order arrives, it consumes the available limit orders on the opposite side of the book. The size of that consumption, the speed at which it occurs, and the price at which absorption slows or reverses all communicate information about the underlying supply and demand dynamics that no candlestick chart can fully capture.
Volume Profile: The Market's True Memory
Volume profile is among the most practically useful tools available to traders who want to understand market structure beyond surface-level price action. Unlike a traditional volume histogram — which simply shows how much was traded during each time period — a volume profile maps trading activity across price levels, revealing where the market has spent the most time and transacted the most volume.
The high-volume nodes on a profile represent price areas where buyers and sellers reached extended agreement — zones of equilibrium. The low-volume nodes represent areas of rapid price transition, where neither side wanted to transact at length. These structural features are not arbitrary. They define the map of institutional interest in a given market.
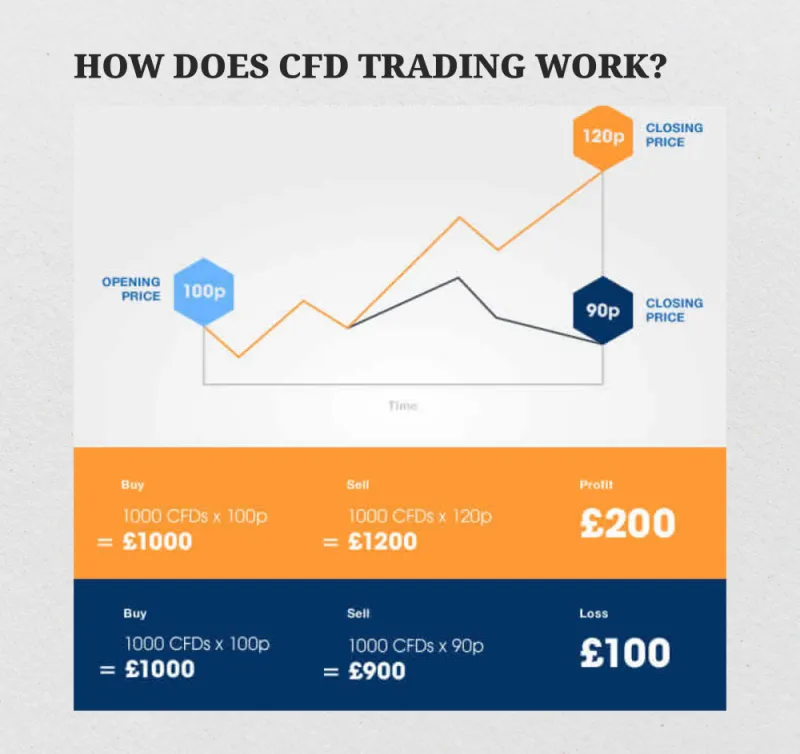
For US traders analyzing forex pairs or equity index CFDs on IC Markets ZHV, volume profile data can reveal several critical insights:
- Value Area High and Low (VAH/VAL): The boundaries within which approximately 70 percent of the previous session's volume occurred. Price returning to these boundaries frequently encounters renewed institutional interest.
- Point of Control (POC): The single price level with the highest traded volume. This level often acts as a gravitational center, with price repeatedly revisiting it over subsequent sessions.
- Low Volume Nodes (LVNs): Areas of minimal transactional interest that price tends to move through quickly. These are the zones where stop-loss cascades accelerate, because there is no liquidity to slow the move.
Institutional traders use this architecture not just to understand where the market has been, but to anticipate where it is likely to move and how quickly.
Level 2 Data and the Art of Reading Intent
The Level 2 order book provides a real-time view of resting limit orders on both the bid and ask side of the market, typically displayed across multiple price levels. For traders accustomed to reading only the top-of-book price, Level 2 data introduces an entirely different dimension of market intelligence.
Large resting orders visible in the book — often called icebergs when only a fraction of the total order is displayed — can signal institutional positioning. However, sophisticated participants are well aware that their orders are visible, which is why interpreting Level 2 data requires understanding deception as much as transparency.
A large bid sitting several ticks below the current price may represent genuine institutional support, or it may be a spoofing order placed to create the appearance of demand and influence short-term price movement before being pulled. Learning to distinguish between the two requires attention to order persistence: genuine support tends to absorb selling pressure and remain in place, while spoofed orders disappear the moment price approaches them.
For practical application, traders should track the following:
- Order absorption: When price tests a level and large orders are consumed without the price moving through, this indicates strong institutional interest at that zone.
- Order stacking: Clusters of limit orders at round numbers or at levels corresponding to obvious technical structures (prior highs, lows, pivot points) often represent institutional positioning ahead of anticipated retail order flow.
- Bid-ask imbalance: Significant asymmetry between the volume resting on the bid versus the ask can foreshadow directional movement as the thinner side of the book is more vulnerable to being swept.
Positioning Ahead of Stop-Loss Cascades
Perhaps the most practically valuable insight that order flow analysis offers retail traders is an understanding of where stop-losses are likely to be clustered — and therefore where price is likely to be driven by institutional participants who benefit from triggering them.
Retail traders, by and large, place stops in predictable locations: just below obvious support levels, just above obvious resistance levels, and at round numbers. This is not a criticism — it reflects the natural tendency to use chart-visible structures as reference points. But because these locations are so predictable, they effectively become targets. Institutional algorithms and experienced prop traders know that sweeping these levels generates the liquidity they need to enter or exit large positions efficiently.
The practical technique for positioning ahead of these events involves identifying the obvious levels where retail stops are concentrated, observing order flow behavior as price approaches those levels, and watching for the absorption pattern that signals an institutional participant is already positioned for the sweep.
On a Level 2 book, this often appears as a build-up of limit orders just beyond the obvious stop level — the institutional participant positioning to buy the liquidity that will be generated when retail stops are triggered. Combined with a volume profile showing a low-volume node beyond the level (which would allow price to move quickly through the stop zone before reversing), this setup represents one of the cleaner opportunities available to traders who understand the mechanics.
Building the Habit of Flow-First Analysis
Integrating order flow analysis into a trading routine does not require abandoning technical analysis. Rather, it means adding a deeper layer of context to every setup. Before entering a trade, ask not just what the chart suggests, but what the order book reveals about the conviction behind that setup.
At IC Markets ZHV, active traders have access to the data streams and analytical tools necessary to begin developing this skill. The learning curve is real, and fluency in reading order flow takes time to develop. But the traders who invest in that development gain access to a dimension of market intelligence that the majority of retail participants never see — and that asymmetry, consistently applied, is the foundation of durable edge.