Calm Before the Surge: Why Volatility Spikes Are the Signal Serious Traders Have Been Waiting For
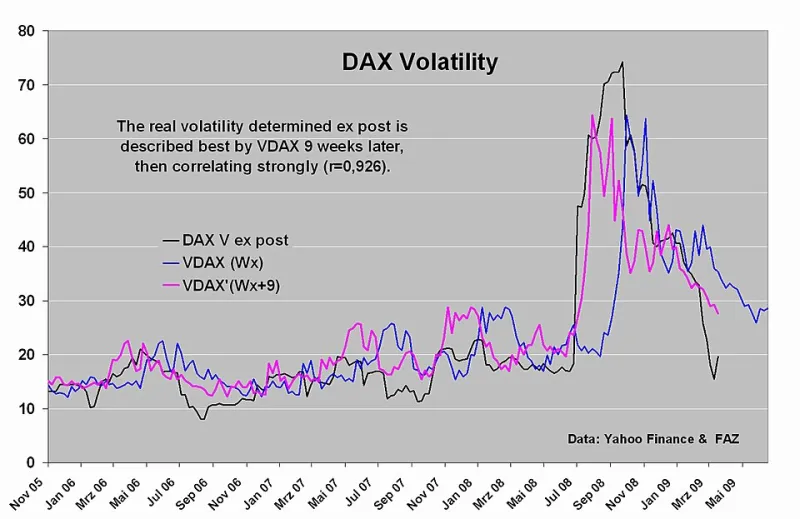
Photo: Gaschroeder, Public domain, via Wikimedia Commons
There is a persistent and costly misconception among retail traders in the United States: that volatility is the enemy. When the VIX spikes, when currency pairs begin printing wide-ranging candles, when Bollinger Bands spread apart like a tightening vice releasing pressure — the instinct for most is to close positions, reduce exposure, and wait for conditions to normalize.
Institutional traders do not share that instinct. They have a different framework entirely — one built on the recognition that volatility is not noise. It is information. And in many cases, it is the most reliable directional signal available in both forex and CFD markets.
Rethinking What Volatility Actually Measures
Volatility, in its most precise definition, is a statistical measure of the dispersion of returns over a given period. What that clinical definition obscures is the behavioral reality underneath it: volatility is a record of indecision, conflict between buyers and sellers, and the accumulation of pressure that must, eventually, be resolved.
The VIX — often called the market's "fear gauge" — measures the implied volatility of S&P 500 options over a 30-day horizon. When it rises sharply, retail participants typically interpret this as a warning to exit equity and risk-correlated positions, including long positions in pairs like AUD/USD or USD/JPY. But what a VIX spike actually signals is that large institutional players are aggressively pricing in uncertainty — and uncertainty, by definition, precedes resolution.
That resolution tends to be violent and directional. Traders positioned ahead of it, rather than fleeing from it, capture the move.
The ATR as a Compression Gauge
The Average True Range (ATR) is perhaps the most underutilized volatility tool in the retail trader's kit. It measures the average range of price movement over a defined lookback period, typically 14 sessions. Most traders use it as a stop-loss sizing tool — which is valid, but incomplete.
What ATR reveals when studied longitudinally is a recurring pattern: extended periods of contraction followed by sharp expansion. When the 14-period ATR on a major forex pair like EUR/USD drops to multi-month lows, it is not a sign that the pair has become boring. It is a sign that energy is accumulating. The market is coiling.
In the months preceding the Federal Reserve's aggressive rate hike cycle that began in early 2022, EUR/USD spent weeks trading in compressed ranges with historically subdued ATR readings. Traders who interpreted that compression as a reason to ignore the pair missed one of the most significant sustained directional moves in recent memory — a decline that ultimately pushed the pair below parity for the first time in two decades.
Compression does not mean the market has stopped working. It means the market is loading.
Bollinger Band Squeezes: The Geometry of Pending Moves
Developed by John Bollinger in the 1980s, Bollinger Bands plot standard deviations above and below a moving average. When volatility is high, the bands widen. When volatility contracts, they narrow — a condition known as a "squeeze."
The squeeze is not a trading signal in isolation. It does not tell you which direction the breakout will occur. What it tells you, with a degree of statistical consistency that few indicators can match, is that a breakout is coming. The bands cannot remain compressed indefinitely. The longer and tighter the squeeze, the more forceful the resolution tends to be.
For CFD traders operating across multiple asset classes — crude oil futures, gold, equity indices, and major currency pairs — learning to identify squeeze conditions across a watchlist transforms the analytical process. Instead of reacting to moves after they have already begun, traders using Bollinger Band squeeze detection are positioning in advance of them.
Paired with volume analysis or order flow data, the squeeze becomes a genuinely powerful tool for identifying high-probability entry windows.
Why Retail Traders Consistently Get This Wrong
The behavioral explanation for retail aversion to volatility is rooted in loss aversion — a well-documented cognitive bias in which the psychological pain of a loss is felt roughly twice as intensely as the pleasure of an equivalent gain. Wide-ranging candles trigger that aversion viscerally. The account equity fluctuates rapidly. The emotional discomfort is real.
But emotional discomfort and analytical danger are not the same thing. In fact, they are often inversely correlated. The periods of lowest volatility — the quiet, grinding consolidations that feel comfortable — are frequently the periods of highest risk. Tight ranges build complacency. Traders hold oversized positions because the daily fluctuations seem manageable. When the breakout arrives, those positions are devastated precisely because they were sized for calm conditions.
Institutional desks, by contrast, operate on volatility-adjusted position sizing as standard practice. They reduce position size during high-volatility environments not because they fear the move, but because they are managing the statistical range of outcomes with precision. They remain in the market. They remain directional. They simply scale appropriately.
Practical Application for the Active Trader
Applying this framework does not require institutional infrastructure. It requires a shift in perspective and a disciplined analytical process.
First, monitor the VIX regularly as a macro context tool, even if you trade primarily in forex or commodity CFDs. A rising VIX signals risk-off flows that will affect correlated assets across the board. Understanding that context allows you to align directional bias rather than fight it.
Second, build ATR compression scans into your watchlist review. When ATR on a major pair drops to its lowest level in 60 or 90 sessions, elevate that pair in your priority queue. It is not a trigger to enter — it is a trigger to pay close attention.
Third, overlay Bollinger Bands on your primary timeframe and mark squeeze conditions. Combine with a momentum oscillator such as the RSI or MACD to identify the early stages of directional commitment as the squeeze resolves.
Finally, and most importantly, recalibrate your position sizing model to account for volatility. Use ATR-based stop distances rather than fixed pip values. This ensures that when you do participate in a high-volatility breakout, your risk remains consistent regardless of how wide the candles are printing.
The Trader Who Leans In
The most consistent performers in forex and CFD markets are not those who find the calmest conditions. They are those who have learned to read the market's energy states accurately — to distinguish between random noise and the structured compression that precedes directional resolution.
Volatility is not your adversary. Misreading it is. The traders who internalize this distinction are not simply taking on more risk for the sake of larger gains. They are operating from a more accurate model of how markets actually behave — one that treats periods of apparent chaos not as warnings, but as the most reliable signals the market produces.