Depth Is an Illusion: What US Traders Miss About Real Liquidity in Forex and CFD Markets
Photo: The original uploader was Snow storm in Eastern Asia at English Wikipedia., CC BY 3.0, via Wikimedia Commons
There is a moment that nearly every active trader has experienced — a setup forms cleanly on the chart, the signal confirms, the entry looks precise, and then the fill comes back worse than expected. Sometimes significantly worse. The price that appeared available on the screen was never truly available at scale. What the trader saw was a liquidity mirage: a reflection of market conditions that dissolved the instant an order was placed into it.
This is not a glitch. It is not a broker issue in most cases. It is the fundamental gap between displayed liquidity and actual executable depth — and closing that gap is one of the most impactful adjustments any serious trader can make to their execution strategy.
The Difference Between Volume and Liquidity
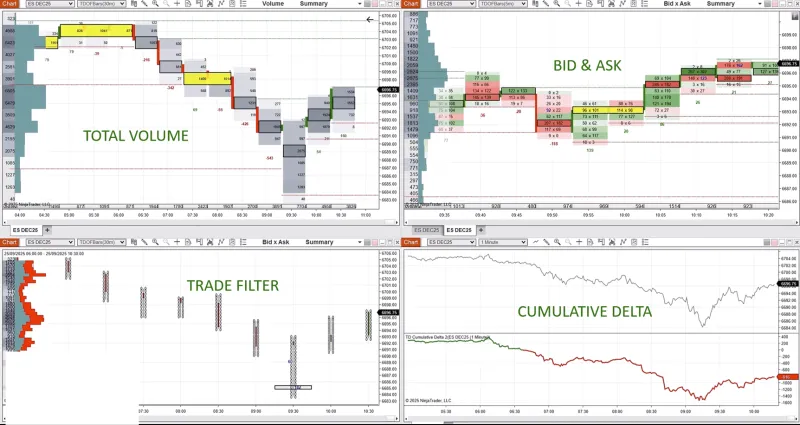
Retail trading platforms present market data in a way that is visually intuitive but structurally incomplete. A tight bid-ask spread on EUR/USD or a CFD instrument like the S&P 500 index communicates efficiency, not depth. Volume indicators confirm that transactions are occurring, but they say very little about where those transactions are happening, at what size, and from which participants.
Liquidity, properly understood, refers to the ability to execute a transaction at or very near the quoted price, at the size required, without materially moving the market against you. For a retail trader placing a 0.1 lot order on a major currency pair during the London session, this definition is largely satisfied. Scale that order up, shift the session to the overlap between Asia and Europe, or move into a less-traveled pair, and the definition begins to fracture.
The visible order book — when accessible — represents only a fraction of the orders actually influencing price. Much of institutional order flow operates through dark pools, internal matching engines, and prime brokerage arrangements that never appear on a standard retail feed. The price you see is a summary of a negotiation happening at a level of infrastructure that most retail platforms simply do not expose.
Why Entry Points Vanish Between Chart Ticks
Forex and CFD markets update continuously, but charting software renders that movement in discrete intervals — one-minute candles, five-minute candles, tick charts with defined minimums. Between those rendered points, price can move, liquidity can shift, and the conditions that made an entry attractive can evaporate entirely.
This is especially pronounced around economic data releases. A US non-farm payrolls report, a Federal Reserve rate decision, or a surprise Consumer Price Index reading can shift the bid-ask spread on major pairs from two to three pips to twenty or thirty pips in a fraction of a second. A trader watching the chart sees the candle close and the setup confirm. By the time the order is submitted, the spread has widened, the available volume at the intended price has been absorbed, and the fill arrives several pips away from the entry.
The entry point did not move slowly. It disappeared, and a worse one replaced it almost instantaneously.
How Institutional Traders Execute Differently
Large institutional participants — banks, hedge funds, proprietary trading firms — approach liquidity not as a given but as a resource to be managed. They do not simply place market orders and accept whatever fill the market provides. They use algorithms designed to slice large orders into smaller tranches, time execution across multiple liquidity providers, and avoid tipping their hand to other participants who monitor order flow for information.
This is why a major institutional buy order rarely appears as a single large candle. It arrives as a series of smaller transactions distributed across time, designed to minimize market impact. The cumulative effect becomes visible on longer timeframes, but the individual executions are engineered to absorb available liquidity without exhausting it.
For US retail traders, the lesson is not that institutional tools are inaccessible — it is that the underlying logic of liquidity-aware execution can be applied at any scale. Thinking carefully about when you enter, at what size, and through what order type is the retail equivalent of institutional execution management.
Practical Adjustments for Retail Execution
Adapting your execution strategy to account for real liquidity conditions does not require proprietary technology. It requires a shift in how you think about the relationship between your order and the market receiving it.
Session timing matters more than most traders acknowledge. The London-New York overlap, typically between 8:00 AM and 12:00 PM Eastern Time, represents the deepest liquidity window in the global forex market. Major pairs like EUR/USD, GBP/USD, and USD/JPY carry the tightest spreads and the most genuine depth during this window. Entering positions outside of it — particularly during the Asian session on non-Asian pairs — exposes you to wider spreads and thinner books that amplify slippage risk.
Limit orders change the liquidity equation. A market order takes whatever liquidity is available at the moment of submission. A limit order specifies the price at which you are willing to transact and waits for the market to come to you. The tradeoff is that the order may not fill at all if the market does not reach your price. But for traders whose primary concern is entry quality, limit orders eliminate the risk of being filled at a price materially worse than the intended one.
Position sizing must account for liquidity, not just risk percentage. Standard risk management frameworks calculate position size based on account equity and stop-loss distance. A more complete framework also considers whether the intended position size can be absorbed by the market without generating meaningful slippage. In highly liquid pairs during peak sessions, this concern is minimal. In exotic pairs, small-cap CFDs, or during off-hours, it becomes a genuine variable in the calculation.
Avoid entries immediately before scheduled data releases. The minutes preceding major US economic announcements are among the worst times to establish a new position. Spreads widen in anticipation of volatility, market makers pull bids and offers to protect themselves, and the liquidity that appeared available moments earlier contracts sharply. Waiting for the initial volatility to resolve — typically two to five minutes after the release — allows spreads to normalize and depth to return before committing capital.
Reading the Market as It Actually Exists
The most persistent challenge in retail forex and CFD trading is not analytical — it is perceptual. Charts present a cleaned, rendered version of market activity that is accurate as historical record but incomplete as a real-time execution guide. The gap between what the chart shows and what the market will actually deliver is filled by liquidity mechanics that most retail education programs never address.
At IC Markets ZHV, the framework we consistently return to is this: analysis determines direction, but execution determines cost. A trader who identifies the right move but enters poorly still pays for that imprecision through slippage, widened stops, and reduced reward-to-risk ratios. Over hundreds of trades, those execution costs compound into a measurable drag on performance.
Understanding that displayed liquidity is a representation rather than a guarantee is not a reason for pessimism. It is a reason to be more deliberate — about session selection, order type, position sizing, and the conditions under which you choose to act. The traders who recognize the mirage for what it is are the ones positioned to execute through it rather than into it.